
We share the interest others have in bridging the gap between the research community and instructional designers. Researchers are experts in measurement, and often have useful insights to provide, particularly to policymakers. But they rarely provide information on the “why,” which allows a design team to make improvements to their program. Most studies give an up or down measurement on a particular program, but rarely the underlying mechanisms that led to its “up-ness” or “down-ness.”
Instructional designers need the “why,” and often come to rely on evidence that is perhaps less precise, or rigorous than what the research community can provide.
How to resolve this?
We think the answer is twofold: (i) try harder to ring utility out of the higher-quality evidence, (ii) use that evidence as a conversation-starter, not finisher.
An Example
How might one study, when combined with others, be used as a conversation starter?
Let’s look at the results from Lipcan and Crawfurd’s recent study that compared private schools, Bridge schools, and government schools in Lagos Nigeria.
Note: We consider the results of the program purely through the filter of program design, or how the quality of teaching and learning may have impacted learning outcomes.
This was not the focusing question of the research, and indeed the study spans far wider than that; management practices, rate of corporal punishment, the authors even use the Oster coefficient to inform return on investment calculations for Nigerian parents. Most of those metrics strike me as interesting and useful, and they have spurred productive discussion and debate elsewhere.
But this is a narrower discussion — our team designs instructional materials and develops teacher training, and so we stay within those parameters.
Some Caveats
Through that filter, three caveats up front.
First, the test was administered one third of the way through the school year. This is crucial because we can evaluate what had been taught, and what hadn’t been taught, by that time. It helps us corroborate what we are finding on other sources of data — numeracy assessments, field officer observations of classrooms.
Second, some of the skills assessed were not part of the 2nd grade national curriculum published by Nigerian Educational Research and Development Council (NERDC), nor tied to the supplementary programs we have in place to remediate/accelerate basic skill acquisition in literacy and numeracy. Thus, the test was reasonably but not purely aligned to our program.
Third, the test was administered to second graders, and so has limited value for informing program design below or above that age group.
Those caveats aside, the study was a useful conversation-starter, especially when combined with our other internal evidence.
Student Performance
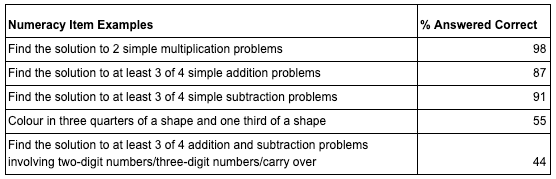
The authors were generous in citing the skills assessed on the exam, and they showed performance on this test at Bridge and elsewhere. Much of the discussion focused on Bridge in comparison to other private schools, and government schools. Let’s avoid that comparison here, and zoom in on Bridge data in Literacy:

And numeracy:
Taking a step back, for a program to generate achievement gains, three conditions must be in place: (i) the quality of teaching must be high(er), (ii) the quality of the program itself must be high(er), (iii) the placement of the students must be right.
Here’s Zig Engelmann’s visual representation –
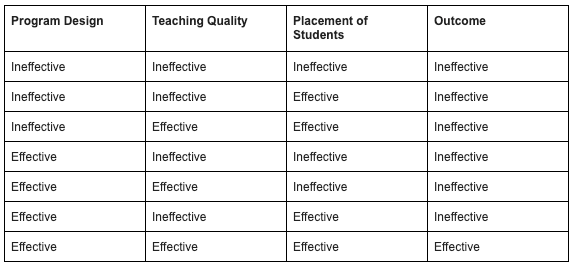
As you can see, all three conditions have to be in place for the outcome to be “effective.”
Let’s stipulate that quality of teaching is not the issue here. (Or, let’s assume for now that it’s not the low-hanging fruit. Bridge teachers are, for the most part, according to the study, doing their job effectively.)
The table removes that variable and simplifies the source of the problem.
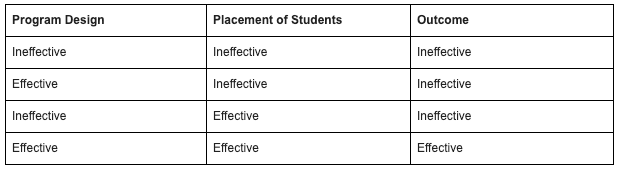
The problem must be the (i) quality of the program, (ii) the placement of students, or (iii) some interaction of those two variables.
Interpretation and Next Steps
We think it’s probably some interaction of both variables.
What conversations did this start?
When we, as a team of instructional designers, looked at the quality of the program, almost all skills that children had been taught were mastered at our defined rate of “above 80%.” This would be promising from a program design perspective. And one place where students tended to struggle — “Colour in three quarters of a shape and one third of a shape” — was not taught until the third term, or several months after the test was administered. So we didn’t worry about that one.
But there were some issues that were worth remedying. We think more kids should be able to “Find the solution to addition and subtraction problems involving two-digit numbers/three-digit numbers/carry over,” at this time, even though a part of that is not covered by NERDC until Grade 3. And — crucially — when we combined this data with sources of information (like our internal assessments and classroom observations), it does appear that our numeracy program could use some adjustments.
What about placement of students? The empirical basis for caring A LOT about this is strong. “Teaching at the Right Level” has generated significant promise over the years as a low-cost intervention. Its logic is simple. Give a child a placement test. Use that test to inform the starting point of the child. Put the child into a homogenous group. It doesn’t always work, though, and the details of implementation seem to matter a lot. And so we want to test it, given that there is significant heterogeneity in student levels across our classrooms in Nigeria.
We hope that by making improvements both to the program, and to the placement of students within the program, we will see better results on a range of numeracy assessments going forward.
We thank the researchers for the information the report provided, and encourage other program evaluations to be similarly transparent about the underlying mechanisms that led to their findings. It helps designers ask questions of their programs, which in turn leads to a more focused conversation, which in turn leads to opportunities for improvement.